
💡 Decoding the SENSEX: A Comprehensive Analysis of BSE’s Historical Performance and Market Evolution
Explore the history of the BSE SENSEX, from its 1986 inception to its status as a global financial benchmark, analyzing its growth, volatility, and sectoral shifts.
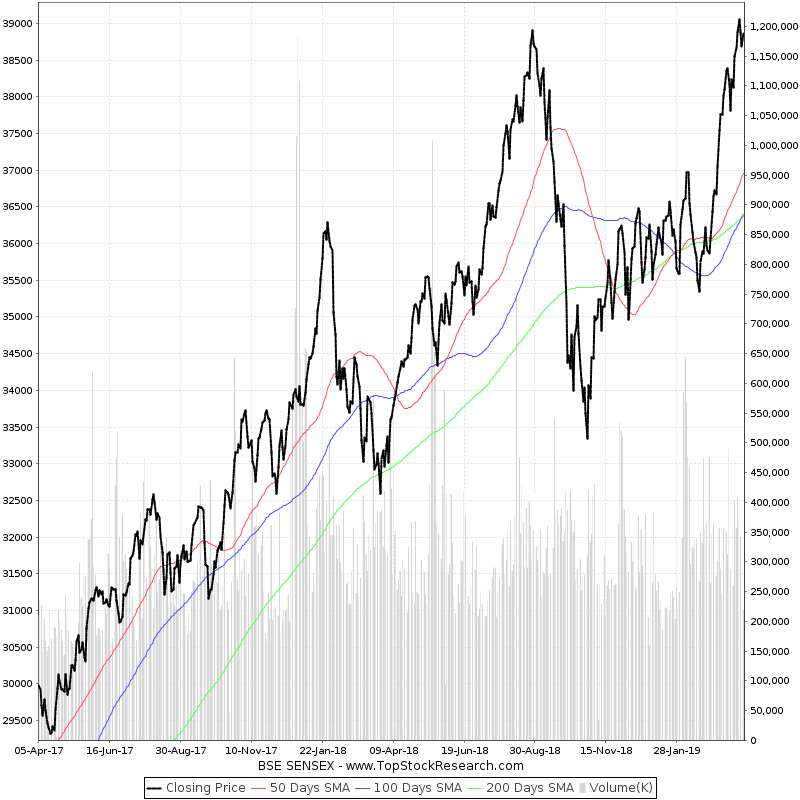
The SENSEX, or the Stock Exchange Sensitive Index, is the benchmark index of the Bombay Stock Exchange (BSE) and serves as the primary barometer for the Indian economy. Comprising 30 of the largest and most actively traded stocks across key sectors, it tracks the pulse of India’s corporate health. Since its base year of 1978-79 (with a base value of 100), the SENSEX has grown to cross the 70,000-point mark, delivering an average annual return of approximately 15-16% over four decades. This performance highlights the index's ability to compound wealth significantly, consistently outperforming inflation and traditional fixed-income assets over long horizons.
The Legacy of Asia’s Oldest Stock Exchange
The story of the BSE began long before the digital screens and high-frequency trading of today. Established in 1875 as 'The Native Share & Stock Brokers' Association,' the BSE is the oldest stock exchange in Asia. It famously started under a banyan tree in Mumbai, where brokers gathered to trade shares of companies like the East India Company. This humble beginning laid the foundation for organized capital markets in India.
For over a century, the BSE operated through a manual system of 'open outcry,' where traders shouted prices and used hand signals to execute deals. It wasn't just a marketplace; it was the focal point of India's early industrialization, helping raise capital for the country’s first textile mills, steel plants, and railways. Today, it stands as a symbol of India's financial resilience and its transition into a modernized, globalized economy.
The Genesis of the SENSEX: Understanding the Benchmark of Indian Equity
While the BSE has been around since the 19th century, the SENSEX was only officially launched in 1986. The index was designed to provide a standardized measure of market performance. Initially calculated using the 'Full Market Capitalization' method, it shifted to the 'Free-float Market Capitalization' methodology in 2003. This means the index only considers shares available for public trading, excluding those held by promoters or the government.
The selection of the 30 constituent companies is rigorous. To be included, a company must be listed on the BSE, have a significant market cap, and maintain high liquidity. This ensures that the SENSEX remains a true reflection of the market sentiment, capturing the movements of the companies that drive the lion's share of India's GDP.
Historical Milestones: From the 1991 Liberalization to the Digital Era
The trajectory of the SENSEX is closely tied to India’s policy shifts. The most defining moment was the 1991 Economic Liberalization. Before 1991, the index moved slowly due to the 'License Raj' and heavy state control. Post-liberalization, as the economy opened to foreign investment and private enterprise, the SENSEX began its upward surge.
- 1990-1992: The index saw its first massive bull run, followed by a sharp correction during the Harshad Mehta era.
- 2003-2008: Often called the 'Golden Phase,' the SENSEX rose from roughly 3,000 to 21,000, fueled by a global commodity boom and strong domestic growth.
- 2014-Present: The transition toward a digital economy, GST implementation, and the surge in retail participation have propelled the index to historic highs.
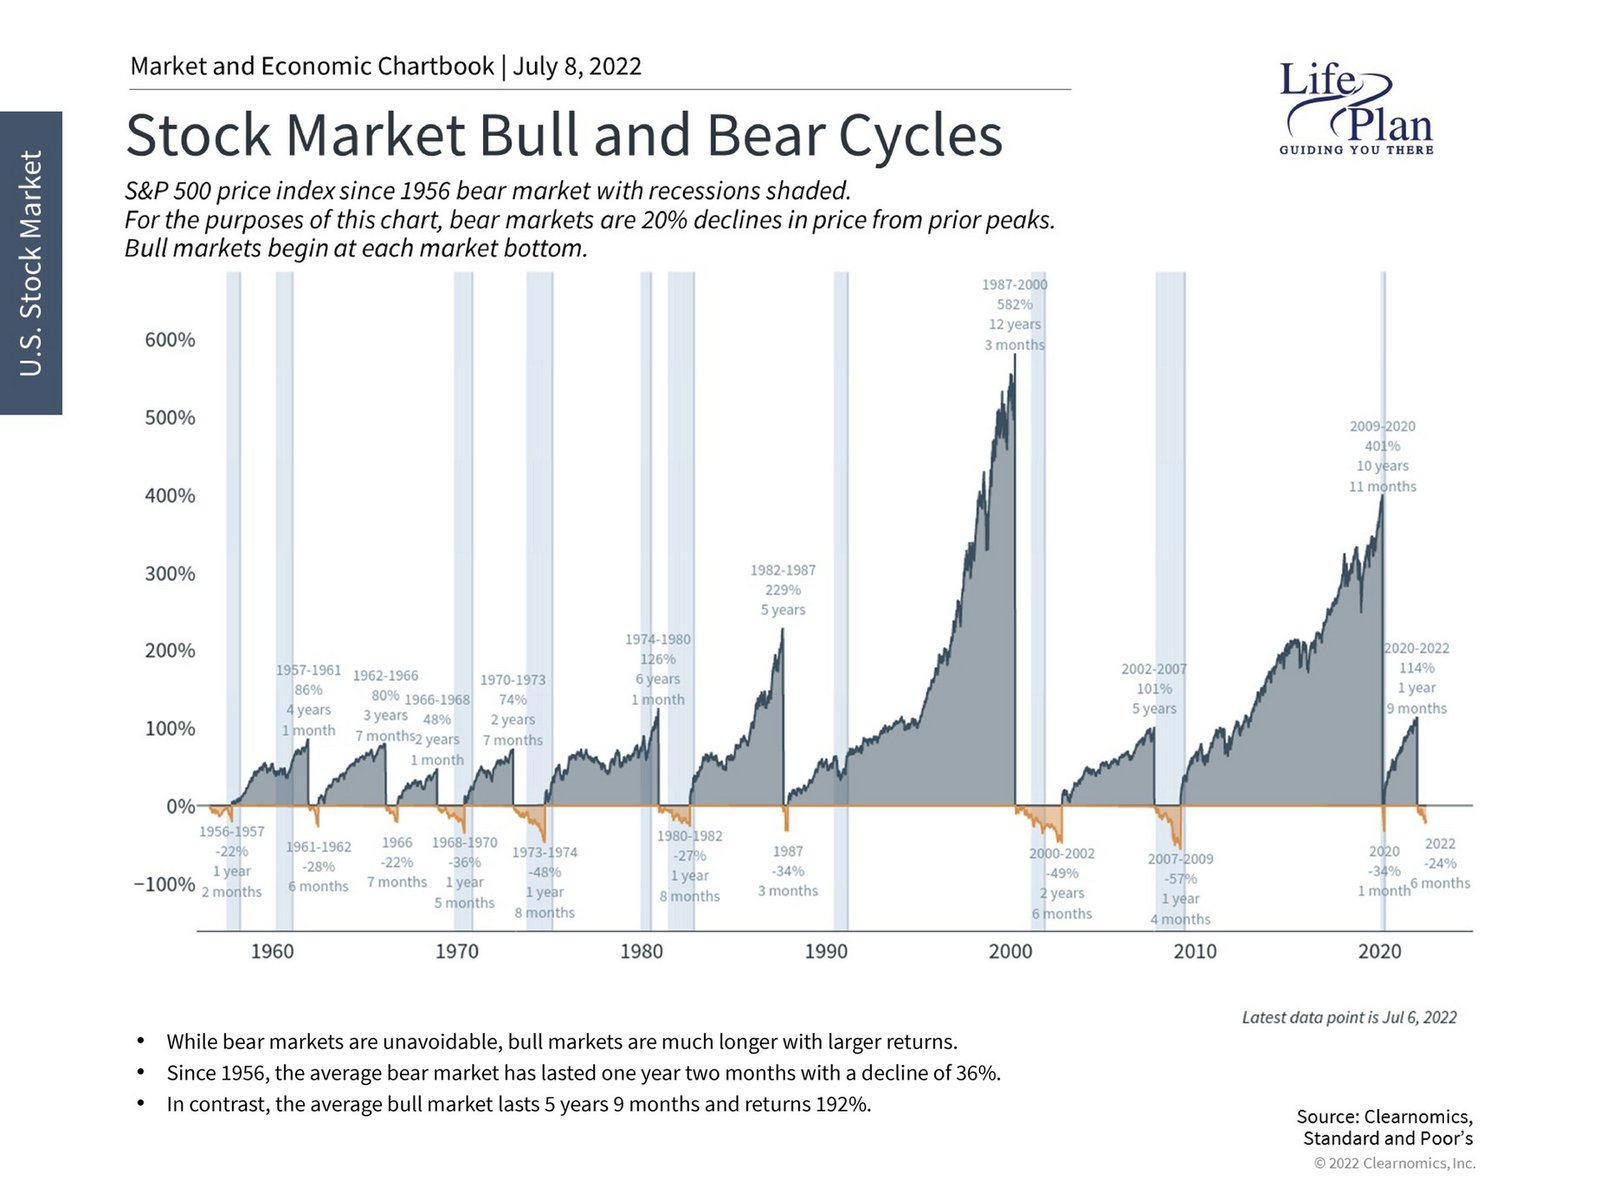
Analyzing Market Volatility: Major Crashes and Their Recovery Timelines
Investing in the BSE has never been a straight line up. The market has faced several 'black swan' events that tested investor patience. Understanding these crashes provides a perspective on the market's inherent resilience.
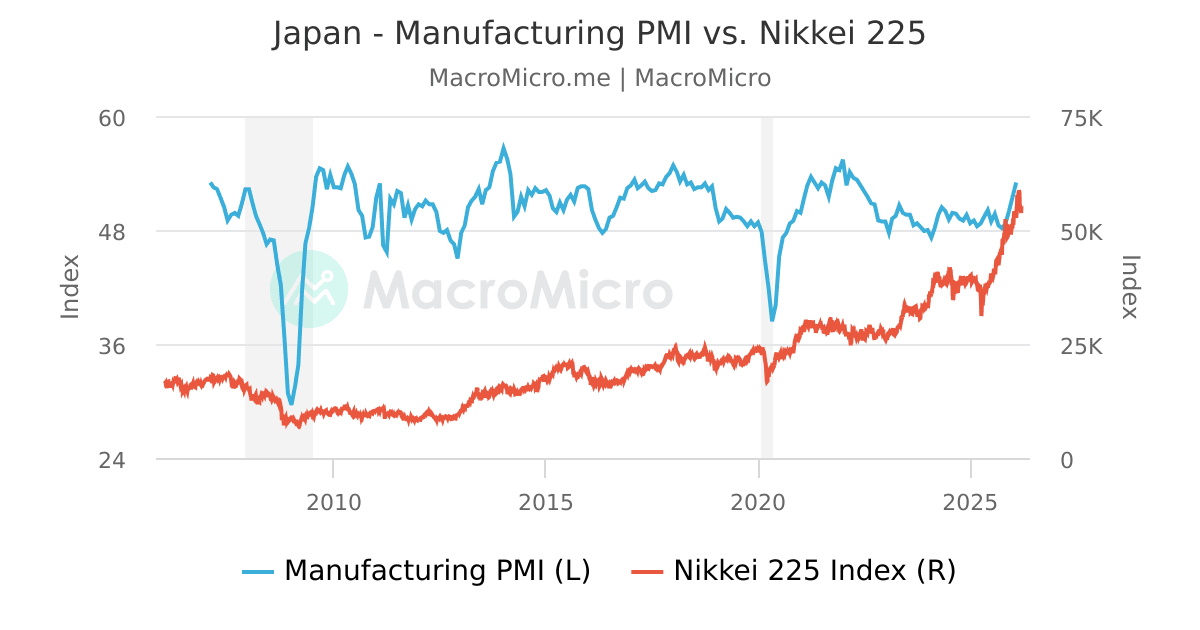
The 2008 Global Financial Crisis saw the SENSEX lose nearly 60% of its value within a year as foreign institutional investors (FIIs) pulled out capital. It took approximately three years for the index to fully recover to its pre-crash peaks. In contrast, the 2020 COVID-19 Crash was much sharper but followed by a 'V-shaped' recovery. The index crashed 38% in a single month (March 2020) but regained all losses by October 2020, driven by massive global liquidity and a surge in new retail investors.
Practical takeaway: Historical data shows that while crashes are inevitable, the Indian market has a 100% recovery rate over a 3-5 year window, rewarding those who stay invested through the turmoil.
Sectoral Transformation: How the BSE Composition Shifted
One of the most fascinating aspects of the SENSEX is how its composition has evolved. In the 1980s and 90s, the index was dominated by 'old economy' sectors like textiles, cement, and heavy manufacturing. Companies like Century Textiles and ACC were the heavyweights.
By the 2000s, the weightage shifted toward Information Technology (IT) and Banking. Today, the Financial Services sector (including giants like HDFC Bank and ICICI Bank) holds the largest weight, often exceeding 35%. The rise of the services sector and the digital revolution brought companies like TCS and Infosys to the forefront. Reliance Industries also evolved from a textile firm to a petrochemical giant, and finally to a digital and retail behemoth, mirroring the broader transformation of the Indian economy.
The Wealth Creation Effect: Evaluating Long-Term CAGR
The real value of the SENSEX lies in its wealth-creation ability. If an investor had put ₹10,000 into the SENSEX in 1979, that investment would be worth several crores today. This is the power of a 15% Compound Annual Growth Rate (CAGR).
When adjusted for inflation, the SENSEX has provided a "real" return of about 8-9%, which is significantly higher than gold or bank deposits. However, it is important to note the limitations. Diversification is key; while the SENSEX 30 represents the cream of the crop, it doesn't capture the explosive growth (or the risks) of small-cap and mid-cap companies. For a balanced portfolio, the SENSEX serves as the stable core, but it should not be the only exposure an investor has.
Technological Milestones: From Open Outcry to High-Frequency Trading
The BSE has been a pioneer in financial technology in India. In 1995, it replaced the manual trading system with the BSE Online Trading (BOLT) system. This was a revolutionary step that brought transparency and reduced the time required to execute trades.
Today, the exchange operates on one of the fastest trading platforms in the world, with median response times of 6 microseconds. The shift to T+1 settlement (where trades are settled within one business day) has made the Indian market one of the most efficient globally. This technological backbone allows the BSE to handle millions of transactions daily from mobile apps, making the stock market accessible to people in the remotest parts of India.
Frequently Asked Questions
1. What was the starting value of the SENSEX?
The SENSEX has a base year of 1978-79, and its base value was set at 100 points. All subsequent growth is measured relative to this starting point.
2. How often are the 30 companies in the SENSEX changed?
The index is reviewed semi-annually (every six months) by the Asia Index Private Limited (a joint venture between S&P Dow Jones Indices and BSE). Companies that no longer meet the liquidity or market cap criteria are replaced by more eligible ones.
3. Why is the SENSEX called a 'sensitive' index?
It was named 'Sensitive' because it was designed to react quickly to market news, policy changes, and economic shifts, acting as a high-sensitivity thermometer for the Indian equity market.
4. Is SENSEX better than NIFTY 50?
Neither is inherently "better." The SENSEX tracks 30 companies, while the NIFTY 50 (National Stock Exchange index) tracks 50. Because they both track the largest companies in India, their performance correlation is very high (usually over 95%).
5. Can I invest directly in the SENSEX?
You cannot buy the index itself, but you can invest in 'Index Funds' or Exchange Traded Funds (ETFs) that track the SENSEX. These funds buy the 30 stocks in the same proportion as the index, allowing you to mirror its returns.
Important Note: Financial Disclaimer: This content is for educational purposes only and does not constitute professional financial advice. Always consult with a certified financial planner before making investment decisions.
Conclusion
The evolution of the BSE SENSEX from a 100-point experiment to a global financial powerhouse is a testament to India's economic potential. While the journey has been marked by periods of extreme volatility and structural shifts—from manufacturing dominance to a tech and finance-heavy index—the long-term trend has remained decisively upward. For investors, the historical performance of the BSE underscores a simple truth: while the market can be erratic in the short term, it remains one of the most effective vehicles for long-term wealth creation in a growing economy like India. As the country aims for a $5 trillion economy, the SENSEX will likely continue to evolve, reflecting the next generation of Indian corporate leaders.


Comments 0
Leave a Reply
Your email address will not be published. Required fields are marked *
Be the first to share your thoughts!